APPENDIX
Some Sample Calculations
Here are presented some simple examples of model calculations to the GDP in order to demonstrate the effectiveness and suitability of the basic theory to forecast economic growth. The following examples are monetary only linearly calibrated, a dedicated inflation correction was not made. The achievable accuracy depends on the accounting, however, closely linked to the availability and quality of parameters required by the statistical offices.

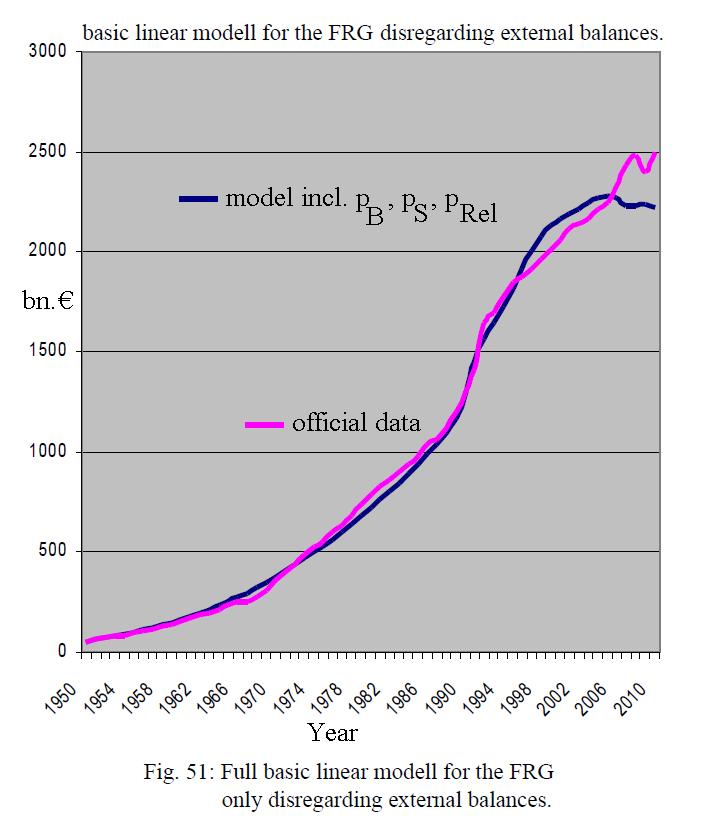
First89 for the FRG: In the above figure we see the result of GDP for the simplest basis model in comparison with official data of the FRG for the years 1950 to 2010. The real numbers were provided by the Federal Statistical Institute and as we see, the calculation is already good, but has some differences. The most significant difference is due to population growth, how shows us the next plot:

In Figure
above is merely the effect of the parameter![]() according to include the data of the FRG population. Clearly visible is
the now very good fit because of the information generated by the addition of
the GDR inclusion GDP jump at the 1990ies.
according to include the data of the FRG population. Clearly visible is
the now very good fit because of the information generated by the addition of
the GDR inclusion GDP jump at the 1990ies.
Instead of the average savings rate![]() and average
interest rate
and average
interest rate![]() and
phenomenological commercial bank share
and
phenomenological commercial bank share![]() ,
next we take the official figures calculated from the official values. Except
for the interest rates, these numbers are determined by the Bundesbank
rather well. The actual average interest rate
,
next we take the official figures calculated from the official values. Except
for the interest rates, these numbers are determined by the Bundesbank
rather well. The actual average interest rate![]() across all asset types is not included in the official data series,
however, and had therefore to be based on the actual annual increase in assets
or Liabilities amounting
across all asset types is not included in the official data series,
however, and had therefore to be based on the actual annual increase in assets
or Liabilities amounting![]() to
be estimated. This results in the following figure. There remain small
uncertainties in the estimation of gross interest rate
to
be estimated. This results in the following figure. There remain small
uncertainties in the estimation of gross interest rate![]() .
.

Finally we
add the externals![]() .
. ![]() and
and![]() are, however, the
sizes that are most difficult to extract from the current official data bases.
One can try to determine them from looking at various time series. In the
following example the time-series data based on series QU1001 of the Bundesbank (national Banks: Foreign Assets Total, all
countries, all currencies used) and then assume to occur in these foreign
assets about 50% of the profits abroad and 50% in the FRG itself. Then there is
the next picture:
are, however, the
sizes that are most difficult to extract from the current official data bases.
One can try to determine them from looking at various time series. In the
following example the time-series data based on series QU1001 of the Bundesbank (national Banks: Foreign Assets Total, all
countries, all currencies used) and then assume to occur in these foreign
assets about 50% of the profits abroad and 50% in the FRG itself. Then there is
the next picture:

The exact accounting of foreign contribution in making the global data bases is in fact the biggest problem. These are hardly be fully listed by official time series. In most countries of the world, the so critical total stock of capital is itself not included. The available data bases are in fact due to the classical view of macroeconomics almost always purely orientated relative to GDP only. In the best case, therefore, the data of GDP are correctly again. The equally important overall bank assets can but often be estimated only from the rudimentary freely available bank data.

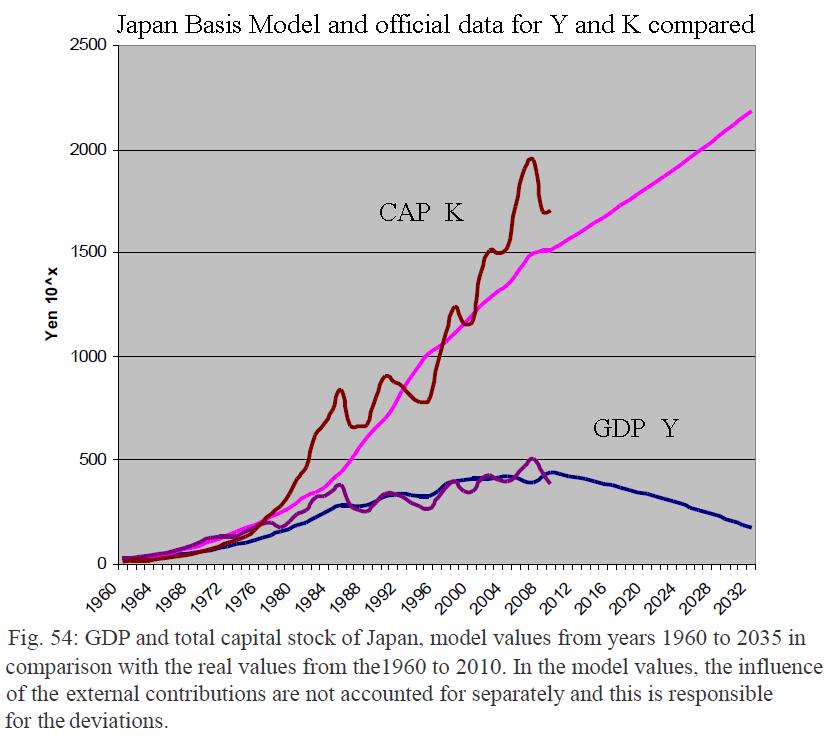
As the next example we take Japan, which quality of similarly to the FRG has good statistical data: Again, the agreement is already good, although Japan has to suffer just from massive fluctuations in foreign assets. Good to see the bubble of the 80s which led to a sharp decline in 1990 and the socalled "lost decade" in Japan. Which gets more clearly in the next figure, in which the Japanese capital stock is seen as well as the model prediction for the coming years, under the assumption of simple and continuous parameter values as a continuation. The divergence between total capital stock and GDP growth is even more significant than in the FRG. In the presently adopted normal continuation of the capital stoc is a significant improvement in the real economic situation in Japan is thus not in sight.

As a
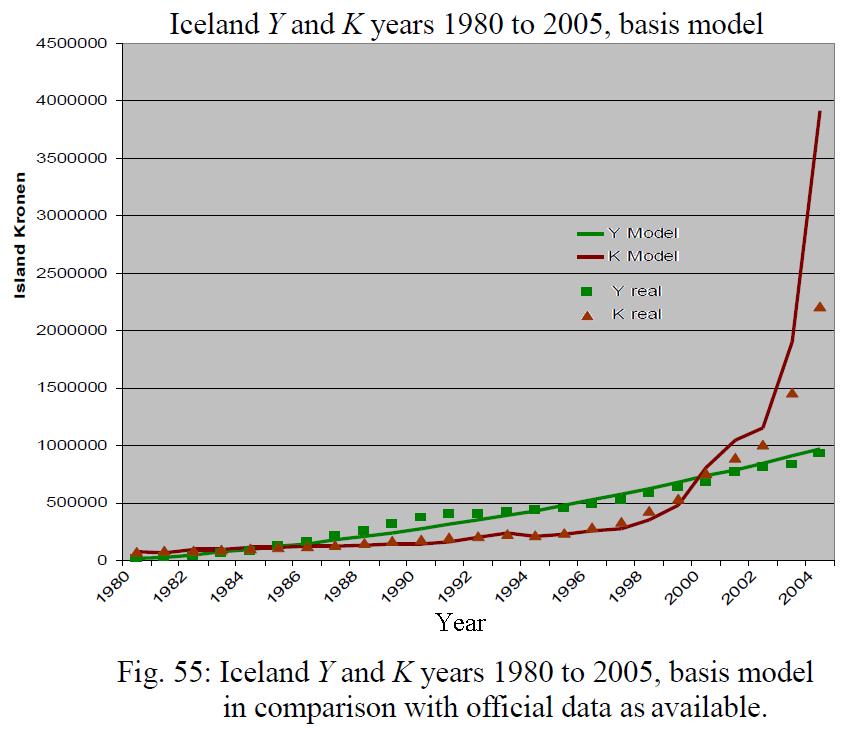
final example we take Iceland. Iceland
experienced an economic dilemma of extreme proportions. Only the assets of the
three largest Icelandic banks together reached up to 10 times the Icelandic
GDP's. According to this extreme load, the GDP in 2005 finally collapsed. Thus
the next plot shows the variation of the available real data and the
calculation according to our model, when comparing years 1980 to 2005. Because
of the enormous extension in the case of Iceland and the fact that the capital
coefficient![]() gets singular for
gets singular for![]() , one assumes to
represent better the reciprocal value, ie the
coefficient of GDP
, one assumes to
represent better the reciprocal value, ie the
coefficient of GDP![]() in the subsequent
plot. The deviations are due to the lack of official data base clearly visible,
but the fit is surprisingly good.
in the subsequent
plot. The deviations are due to the lack of official data base clearly visible,
but the fit is surprisingly good.

