32 Substitution Competition and Public Debt
Even the British economist David Ricardo (1772 - 1823) described public debt as "one of the most terrible scourges that have ever been invented to plague the nation". So today the level of government debt is regarded as one of the most serious problems of the economy. This kind of debt is not a problem limited to a few nations, but appears as a general, perpetual and recurring national dilemma.
 Let us consider the quantity equation analytically using the procedure of the state: Therefor we consider again substitution rules of economics as in chapter
69
26.
In our substitution equation (27.5) with respect to the bank own business, we had already split the financial side of to the two main blocks. The same we can do with the right side
Let us consider the quantity equation analytically using the procedure of the state: Therefor we consider again substitution rules of economics as in chapter
69
26.
In our substitution equation (27.5) with respect to the bank own business, we had already split the financial side of to the two main blocks. The same we can do with the right side![]()
With
![]() and
and
![]() (32.1).
(32.1).
![]() (32.2)
(32.2)
![]() (32.3)
(32.3)
All are commercial products, since all resources in a credit-driven economy, have to be paid out of the immediate use of capital. That labor, wages and salaries, are a resource is in the art. But also as taxes are such, because they make it only possible to provide the necessary state boundary conditions for a prosperous economy and infrastructure ready. Although it is a compulsion of purchase, but that makes no difference to the balance equation. So it is with pensions, and even with social assistance. In each case, products that must be purchased from various good reasons, from the community.
As between income70 from labor71All these products are in
substititional competition for the available money
![]() . The most
important question is, of course, how the state now uses its revenues
. The most
important question is, of course, how the state now uses its revenues
![]() .
.
The particular state of the revenue is now, however, that the state builds up generally no significant reserves, but uses the money raised this year to pay next year's bills. He does it for infrastructure and subsidies of all kinds, including the social obligations, whether in the public service or by awarding contracts to private companies. The total expenditure to be received from taxes, fees and charges from local, state and federal government and spent again, is called the public expenditure quota.
This quota is at the time about 47% of GDP in the FRG. Quotas around 50% are international practice, and the states using quotas above 50%, as Sweden ,are called a "bold" state, and countries such as Switzerland with rates below 40% as a "lean state". The macroeconomic balance equation can now be analyzed as follows:
This year T
![]()
![]()
suggests that government spending initially is negative on the side of the available capital to GDP, because the charges are withdrawn from the total money in circulation and thus the general consumer.
Next year T+1
![]()
![]()
But the last sum goes back by public expenditure next year completely to the volume of trade. Because this money gets almost completely back to the GDP, because the state uses that money to buy goods and services, public and private. So we may write:
![]()
What is the difference, is the effect of the perennial nature:
for the multi-year state budget balance is
![]() (32.5)
(32.5)
![]() deficient state (32.6 a)
deficient state (32.6 a)
![]() ideal state (32.6 b)
ideal state (32.6 b)
![]() profitable state (32.6 c)
profitable state (32.6 c)
However, he does not pay it back
completely, but only gradually, with the surplus resulting from each![]() remains open.
This debt must bear interest at the average rate
remains open.
This debt must bear interest at the average rate![]() on government bonds of different maturities.
on government bonds of different maturities.
![]() (32.7)
(32.7)
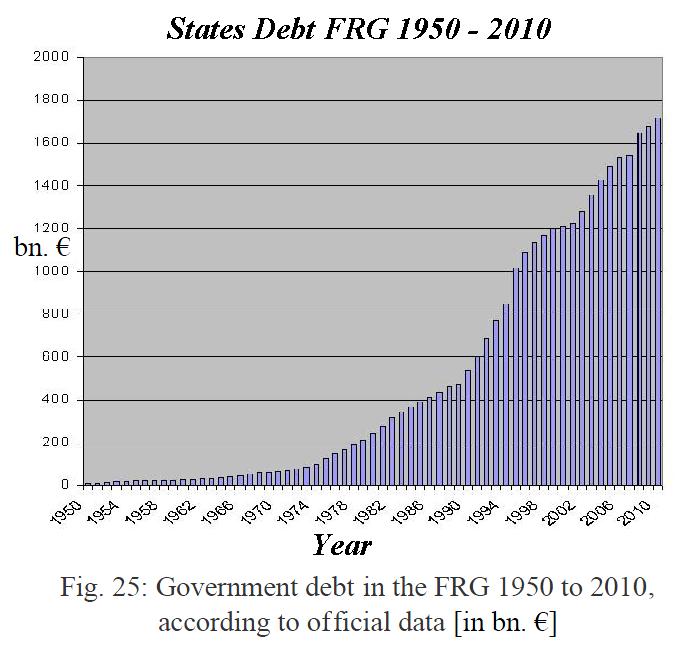
We thus form the sum and record them
against the actual official government debt. The result shows the next figure,
where we have set an average approximate interest rate on government bonds of
different maturities of![]() %. In fact this can explain the fundamentals of
the national debt. Deviations are explained by special state spendings, such as
the GDR acquisition or stimulus packages or with saving programs. In addition
comes the general fact that the development of the interest of government bonds
do not always coincide with the general interest rate trends in other assets.
%. In fact this can explain the fundamentals of
the national debt. Deviations are explained by special state spendings, such as
the GDR acquisition or stimulus packages or with saving programs. In addition
comes the general fact that the development of the interest of government bonds
do not always coincide with the general interest rate trends in other assets.
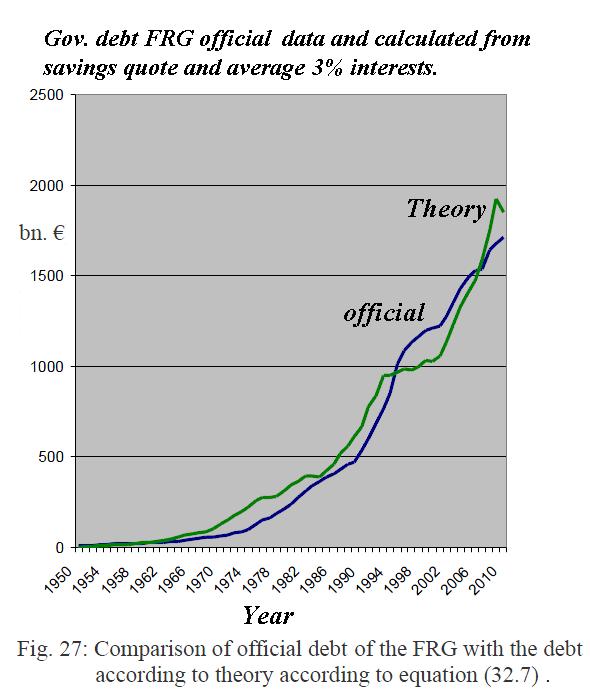
This is not least because government bonds are usually seen as relatively safe bonds, while risky assets make possible higher returns.
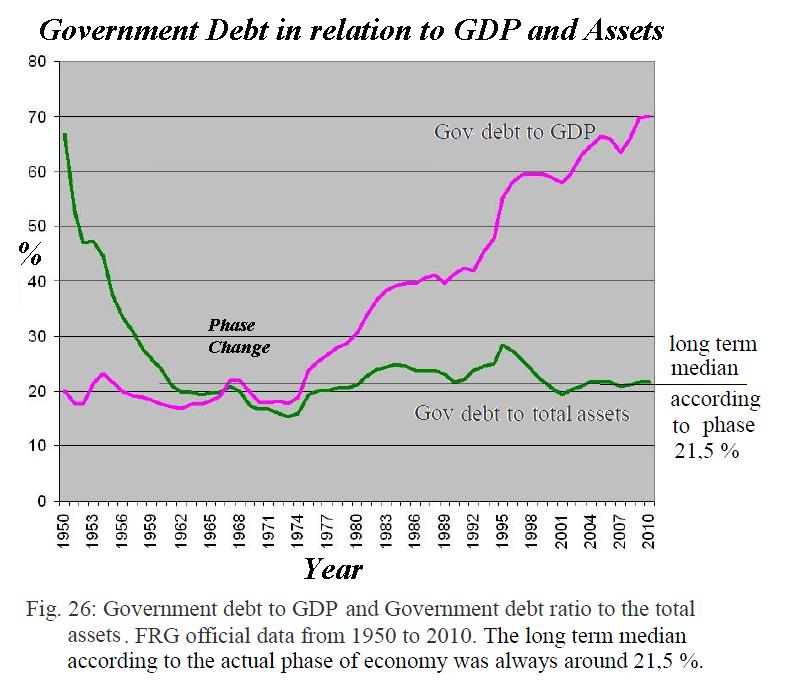
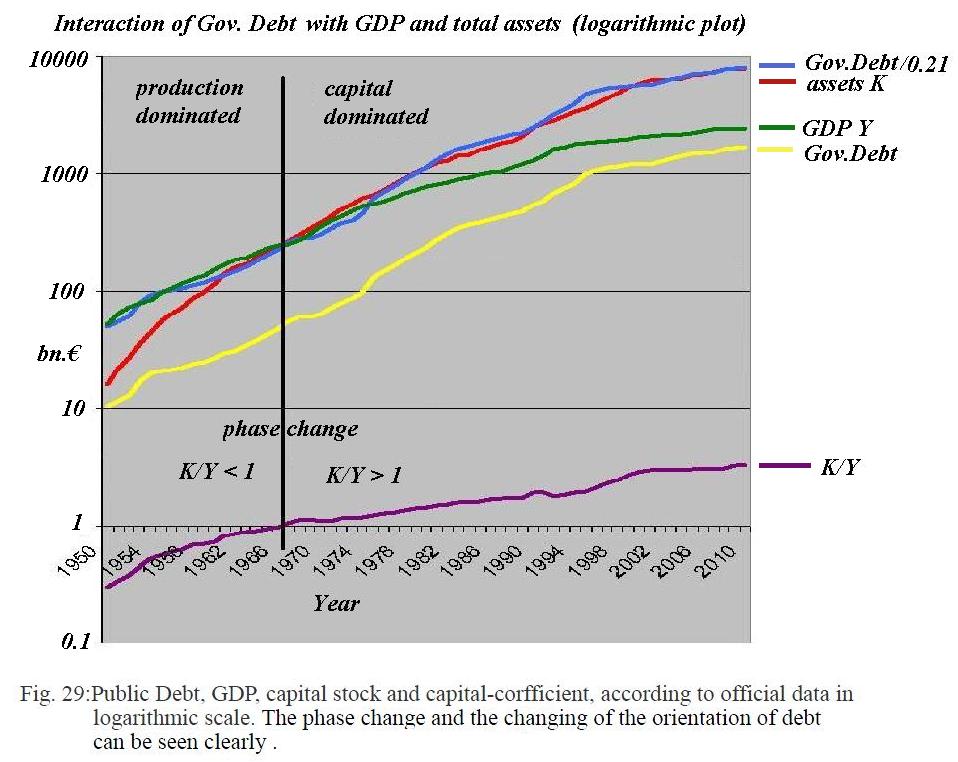
It is worthwhile to analyze the real public debt of the FRG in their symptomatic course: Surprisingly, we see that the national debt in no way gets out of hand, when considered in relation to the capital stock K considered. On the contrary, one can see in Figure 28, which are the official real numbers, that debt was even very stable at a value of about 21% of the capital stock and remains up to the year 2010. Of particular interest is the turning point around the year 1967, when the capital-coefficient for the first time exceeded the value 1: Previously, the national debt was about 20% of GDP and also remained constant, while with respect to the total capital stock was considerably higher. In principle, less surprising, however, that the national debt is based on the general capital development, and less on GDP. Because the state is an commercial operator like everyone else, and can effectively refinance only with the general capital development. As long as the state's share of the overall debt is kept constant, one can not speak of a high public debt.
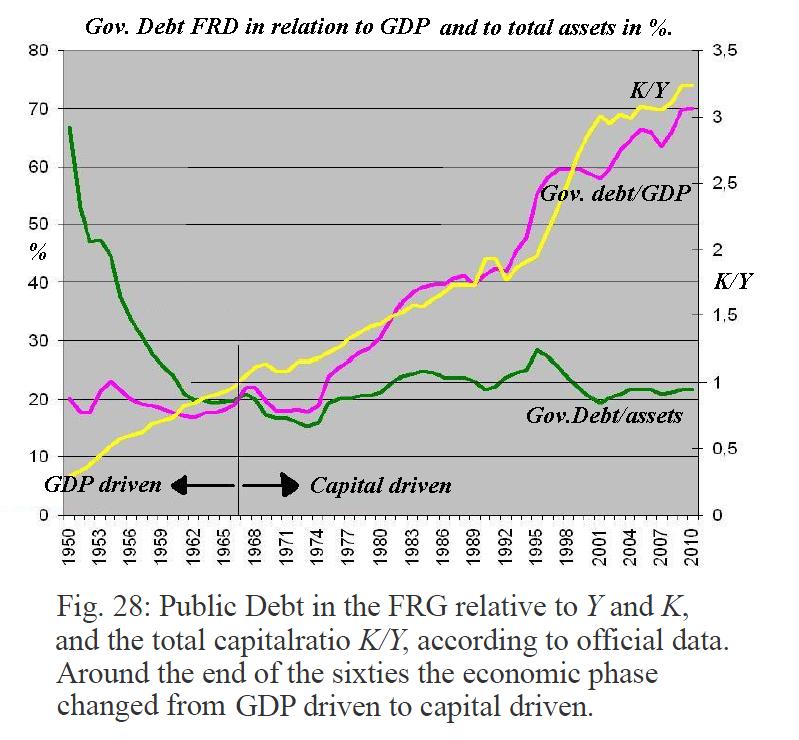
In fact, the state is based on the resources available to him. These are at the beginning of economic development, as the capital-output ratio K/Y (yellow) was still less than 1, the driving factor was the real economy, but then increasingly changes to the capital driven economy with increasing K/Y>1. The above effect of the phase change is clearly visible in a logarithmic chart: You can clearly72 see how the public debt is initially linked to GDP and after exceeding the value of K/Y = 1 linked to the capital stock.
Accordingly, the percentage of
public debt![]() must be correctly
measured by each of the major resources:
must be correctly
measured by each of the major resources:
![]() and
and ![]() (32.8).
(32.8).
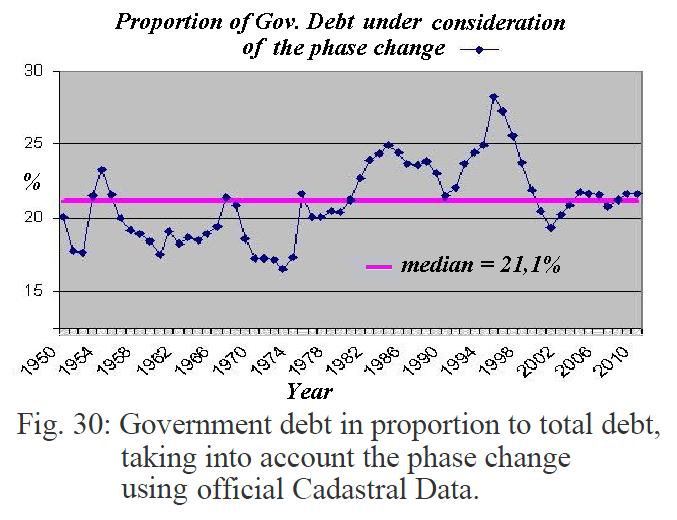
Then there is the following picture: According to (31.8) the national debt by 2010 in the FRG was always in the average at 21.1% of the economically dominant resource:
As the national debt is measured in euros, they should be in a reasonable manner whatsoever communicated in relation to capital stock.
You can see this on the basis of units of the incoming values. Due to the units it is only with respect to the capital stick a formal correct percentage:
![]() (32.9).
(32.9).
Regarding the other hand, with GDP as the basis, we get the less meaningful year as a unit value of the percent debt:
![]() (32.10).
(32.10).
This value is usually communicated, but says essentially something to the time it would take to the total economic debt be paid by spending the entire GDP to pay it off. It is also clear that with a total capital stock of around 8,000 billion euros a national debt of 1800 billion is the lower portion of the economic debt. Nearly 80% of the debt73 is in fact private. This is shown impressively when the measured values of the statistical offices of the national debt are scaled74 with the determined constant value of 21.1%. And then will be compared with the autonomous measured capital stock. The increased government debt in recent decades thus appears to be owed mostly to the general capital development. Even the government can not avoid this common effect.
Increased public debt should be noted only in the reign of Chancellor Kohl by then the integration of the GDR rose temporarily debt above average. By about the year 2000, however, the national debt rose less strongly. This was due to the effect of the dotcom hype, thus leading to high ratings of new technology companies, which the state did not participate in the same way. On the contrary, the UMTS75 auction brought debt-reducing revenues of nearly 51 billion for the treasury in the summer of 2000.